In healthcare, there is a growing push toward personalised advice. Gone are the generic dietary guidelines. People want advice that is most impactful to their situation and their body.
One reason for this shift is that people clearly have different preferences and capacities to implement specific changes in their lives. General advice will not benefit everyone, even if it’s scientifically sound. Another reason for this shift is the belief that everyone responds differently to the same lifestyle change. One person might benefit, another won’t, and maybe someone else will get worse. In turn, over the last couple of decades, researchers have tried, with questionable success, to figure out how to know if people respond differently to a particular treatment.
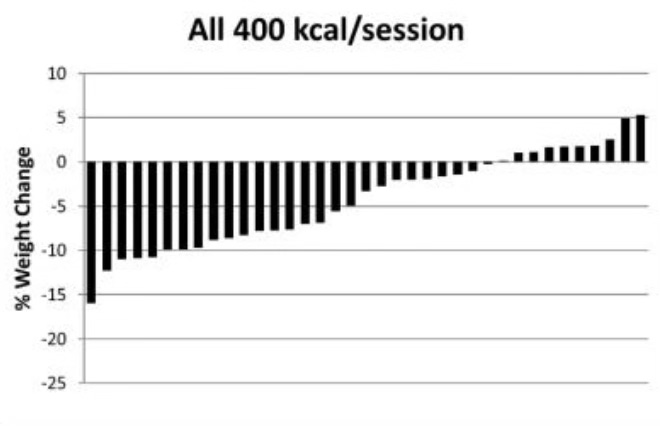
For example, in the waterfall plot below, you can see the differences in how each person’s bodyweight changed after exercising regularly for 10 months (in the Midwest Exercise Trial 2). Each bar represents the change in one person's bodyweight versus their starting bodyweight. As you can see, most of the exercisers lost at least some bodyweight, with some people losing a lot. However, about 25% of the exercisers lost almost nothing or even gained bodyweight.
So here’s my question to you, and take a moment to think about it: in this study, would you say that people responded differently to exercise?
If you answered ‘yes’, you’re in the majority. For many years, intuition led us to assume this type of analysis could be used to infer that people were responding differently to the same intervention. That we’re all unique; some people respond better or worse than others. It’s obvious – look at the graph, they say! Scientifically, this is called treatment heterogeneity, when the effect of a treatment varies in magnitude or direction between people and is not due to random chance.
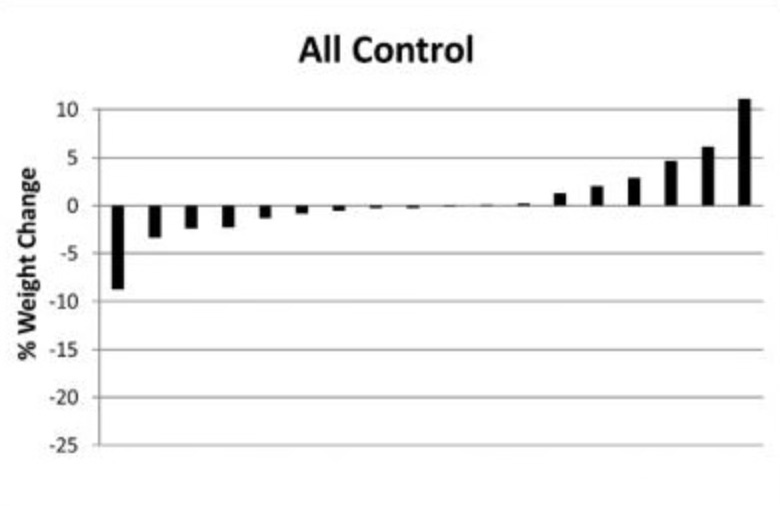
However, as I’ve learnt over the last few years, this assumption is beautifully flawed (thank you, Greg Atkinson). Why, you ask? Look at the waterfall plot below, from the same exercise study, but this time, the graph shows the differences in how each person’s weight changed when not exercising (the control group). You might notice a similar pattern to the first waterfall plot. Some people lost a little bodyweight, others a lot, and some people gained a little bodyweight, others a lot.
So, does knowing this information about the people who didn’t exercise change your thoughts about those who did? It probably should. If we know that people’s bodyweight changed considerably without exercising, often in opposing directions, then we cannot use that same observation in the exercise group to argue for treatment heterogeneity. There was variation in the outcome regardless of whether people exercised or not.
It could be the case that there is demonstrably more variation in the treatment group than in the control group. Though, sometimes there is demonstrably not, and that might be the case with exercise and weight loss. Researchers like Philip Williamson have tested whether the variation in bodyweight change differs between treatment and control groups during exercise studies. He did this by comparing the standard deviation between groups, enabling a test of whether the amount of variation differed, and whether any difference was statistically or clinically significant. As per this method, he found that based on data from 12 exercise trials, there was no significant difference in bodyweight variation between groups. There was also only a 23% probability (labelled ‘unlikely’) that a future study in similar settings would lead to a clinically meaningful (>2.5 kg) difference in bodyweight variation between an exercise group and a control group. (Greg has since found the same lack of variation between groups for low carb versus low fat diets and their effect on bodyweight.)
I want to go a step further here. When I read a book called BURN by Herman Pontzer (which I’ve previously criticised), Pontzer constantly argued that some people lose weight in response to exercise and others do not. Going back to the first waterfall plot in this article, Pontzer argued that anyone who did not lose more than 5% of their bodyweight was a ‘non-responder’ and anyone who lost at least 5% bodyweight was a ‘responder’. Sounds reasonable?
If you think not, I agree. Knowing that some people lost at least 5% of their bodyweight without exercising, we cannot say those exercising who lost this amount were ‘responders’. Equally, on the other end of the spectrum, knowing that some people gained bodyweight without exercising, we cannot say those exercising who also did were ‘non-responders’. The latter point is a little more complex, but explained by the fact that people who gained bodyweight while exercising might have gained more bodyweight if they had not exercised (called the ‘counterfactual' scenario). In that case, these people would still have responded to exercise positively.
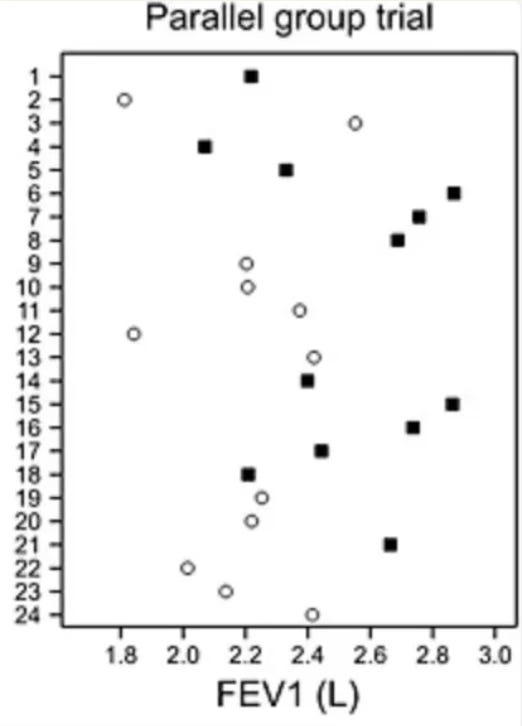
What’s super interesting is that even if people’s bodyweight changed in different directions during an exercise study, they could still have still all had the same response to exercise! Forgive me for going off the exercise narrative briefly, but Stephen Senn, a statistician, illustrated this counterfactual scenario brilliantly with simulated data from a randomised placebo-controlled trial in 24 asthma patients. Observe his graph below, which plots the forced expiratory volume (FEV) of patients in the treatment group (black squares) and the control group (white dots) after the study period. (High values are ‘good’; low values are ‘bad’). As you can see, the data is a bit all over the place, but it seems like some people responded far better to treatment than others.
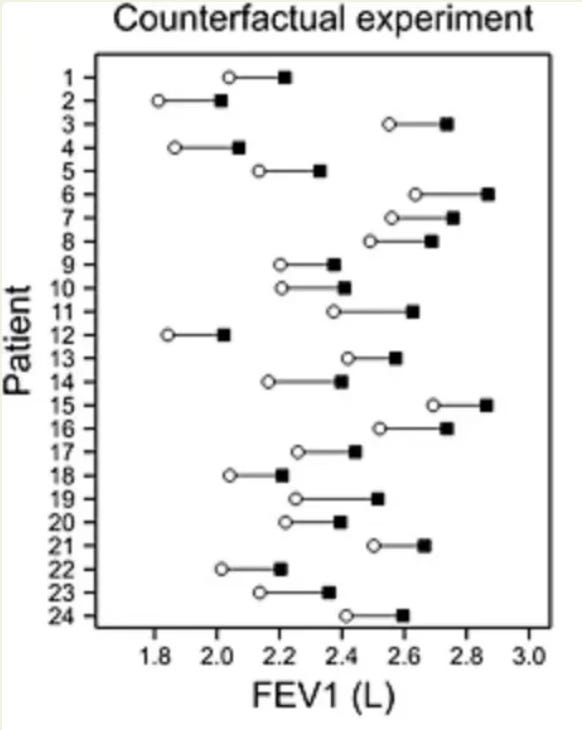
However, as Stephen explains, without testing the counterfactual – that is, what would have happened to people in the treatment group if they were in the control group, and vice versa – it’s impossible to know if people responded differently to treatment. Stephen takes the same data points to simulate a counterfactual experiment with each participant, and illustrates the results in the graph below. As you can see here, despite the initial randomness in the data points, it is still possible that everyone in the study had the virtually the same response to treatment, and that nobody did worse under the treatment than under placebo. Stephen Senn states “Of course, we are not entitled to assume that this is the case if we only see the [graph above]… but the key point is that nothing entitles us to assume that this is not the case.”
If you’ve got a keen eye for research design, you might now think these limitations are easily overcome with a crossover design – when each person in the study gets exposed (in random order) to both treatment and control. In this case, surely you don’t need to assume the counterfactual, right? You can test it directly. I thought this too. Unfortunately, though, it’s still not sufficient to test for differences in individual treatment responses, said people wiser than me.
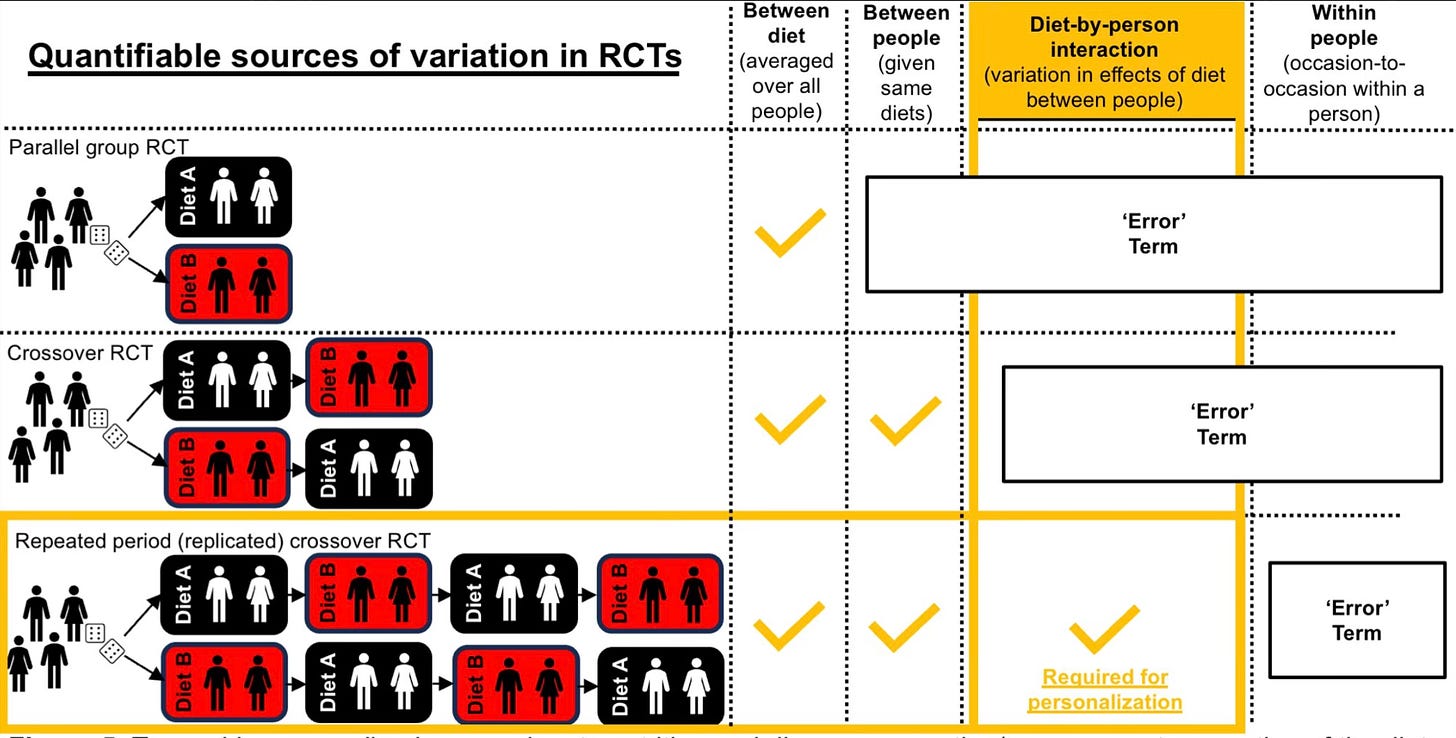
The persisting issue is that a crossover trial is still not a true counterfactual experiment. As I explained earlier, treatment heterogeneity is when the effect of a treatment varies in magnitude or direction between people and is not due to random chance. This latter part is key, because conditions have ultimately changed in a crossover trial once each person is on versus off treatment, such that within-person variability (the degree to which a person's behaviour and environment fluctuate over time) and possibly measurement error cannot be known with only a single exposure to treatment and control. This is illustrated nicely below (by Javier Gonzalez). Basically, while a crossover trial can test for differences in the outcome between people given the same treatment, it cannot test whether such variation is caused by the treatment.
To know how much within-person variability accounts for the variability in the outcome between people, and thus whether any variation is caused by the treatment, each person must engage in the treatment and control arm at least twice. This is called a replicate crossover design. These are rare, but they have been done, mostly in the medical world but also now in nutrition and exercise science.
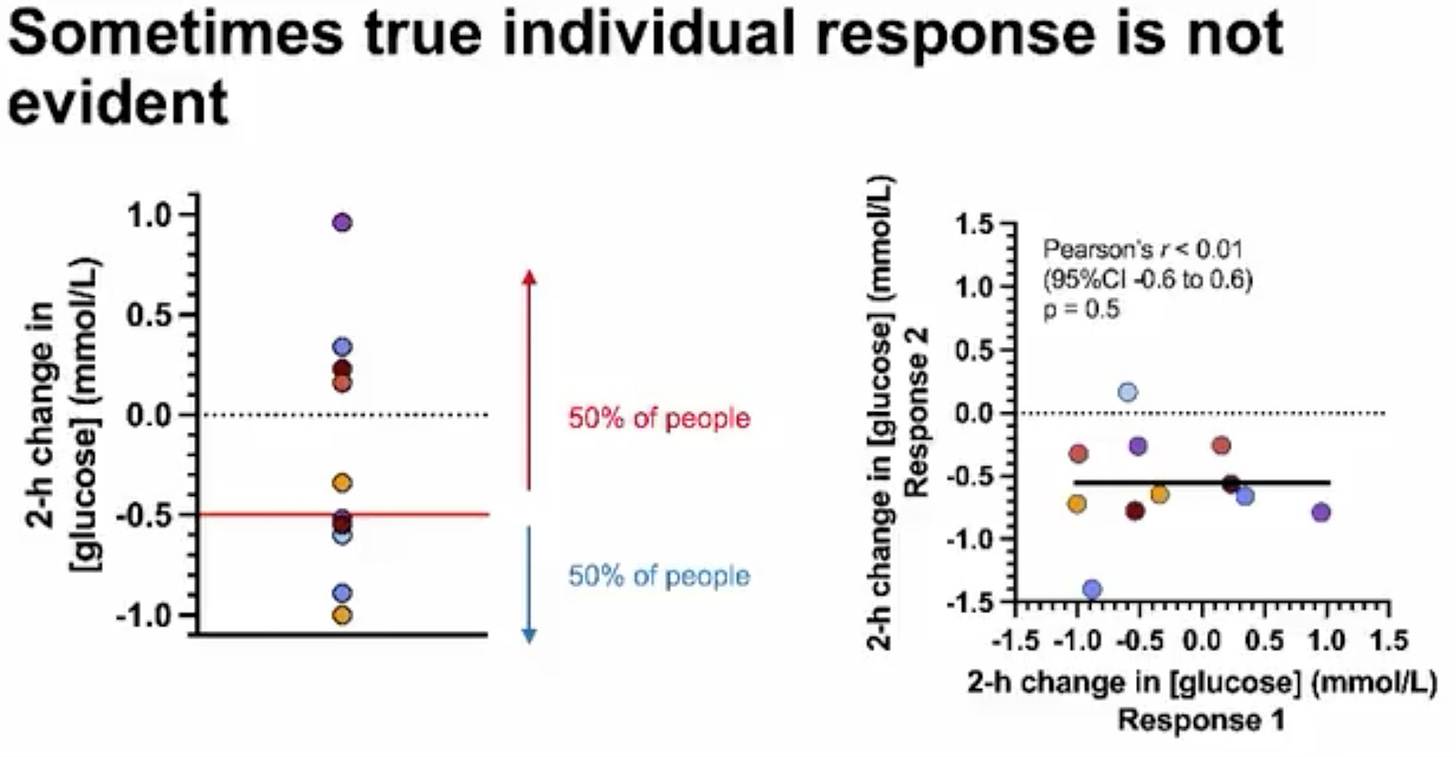
Interestingly, some researchers have actually reanalysed their data from a standard crossover design with data using a replicate crossover design, and found that previously assumed treatment heterogeneity was actually not ‘true’. For example, Javier Gonzalez found wide variation in postprandial blood glucose levels after people ate breakfast versus when they did not (see graph on the left); however, when they repeated the protocol for a second time, it was clear that this was a result of random error – not true differences in individual treatment response.
Considering this, I hope you now raise your eyebrows whenever you next see claims that people respond differently to a treatment. Greg Atkinson states “I am not claiming that elements of individual response can hardly ever be identified. I am claiming that the effort necessary, whether in design or analysis, is rarely made and that labelling patients as ‘responders’ and ‘non‐responders’ according to some largely arbitrary dichotomy is not a sensible way to investigate personal response.” I’m excited for the future of nutrition science and seeing more replicate crossover trials enter my social feeds. For now, I’ll remain sceptical that everyone responds differently to nutrition and exercise interventions, even if it sounds highly plausible.




Are there meta-analyses comparing single-crossover to double-crossover designs on how much they vary?